2023
by Željko Filipin
Introduction
In early 2017 I collected some numbers from the previous years and wrote a blog post titled 2016. A blog post about numbers? How very exciting.
Well, I had fun. In fact, I had so much fun that in early 2024, when I was thinking about writing a blog post, I remembered how much fun it was. (Let me explain how rare that is. By that I mean - me remembering pretty much anything. I can barely remember what I did in the morning. Remembering something that happened in early 2017 is very close to a miracle.)
So, in early 2024, after receiving (one) (several) way too many “year in review” emails from various online services, I thought it could be fun to get some data and write a blog post about 2023.
Getting data for just one year doesn’t really tell a story, so I tried to collect as much historical data as I could, without spending a lot of time on it. 2016 blog post says:
There is a story behind the numbers, but I have spent the time for this blog post collecting the numbers, so the story will have to wait.
That post was one of my first experiments in internet archeology. I wanted to avoid that scenario this time. (By that scenario I mean spending all the time collecting the data, so there’s no time for a story.)
So, the plan:
- Spend as little time as possible collecting as much data as possible.
- Create charts. (Nobody wants to read numbers in tables. Including myself.)
- Write at least one sentence for each chart. (Everybody likes a story. Including myself.)
- Is there an overall story? (My time estimation module tells me there’s a 0.07% chance I’ll have the time for this.) (I don’t really have a time estimation module. I wish I had a time estimation module. My manager wishes I had a time estimation module. My spouse wishes I had a time estimation module.)
I still had the data from 2017 in a spreadsheet that I could use for inspiration and reference. I created a new chart because I didn’t want to mess up that historical and priceles data.
Because of #1 (spending as little time collecting as much data) I decided to gather data only from services that would not fight me. Or at least, they would not fight hard.
Audible
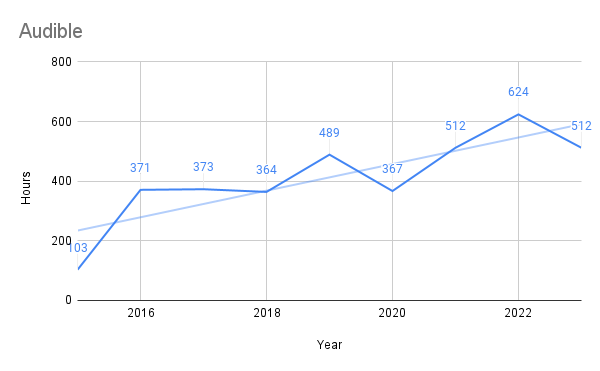
I started using Audible in 2015. Trend is upward. Not in the 2016 post.
In 2016 I didn’t know how important audio books would become in my life. I listen to about an hour or two of audio books a day.
Blog

I’ve been publishing on this blog since 2005. Trend is downward. Also in 2016 post.
I publish a post or two a month. I have changed the software and hosting several times. I really enjoy it, but I have very limited time for it.
Duolingo
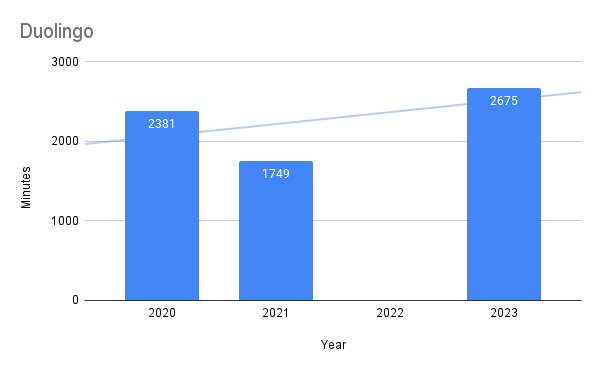
I started using Duolingo in 2020. Trend is upward. Not in the 2016 post.
I could not find data for 2022. Maybe I’ll find something if I dig deeper. I use it 5-7 minutes a day. My German has never been better. (I recently traveled to Germany and mostly used English there. That’s how good it really is.)
Events

The data is from my blog, so since 2005. Trend is upward. Also in 2016 post.
I used to go to a lot of events. I used to speak at events and help organize them. I decided to decrease my attendance at events just before COVID. Then, COVID happened and there were no events to attend, so I didn’t have any trouble with that decision. I enjoy going to events, speaking at them and organizing them. It’s also a lot of time and work.
Geocaching
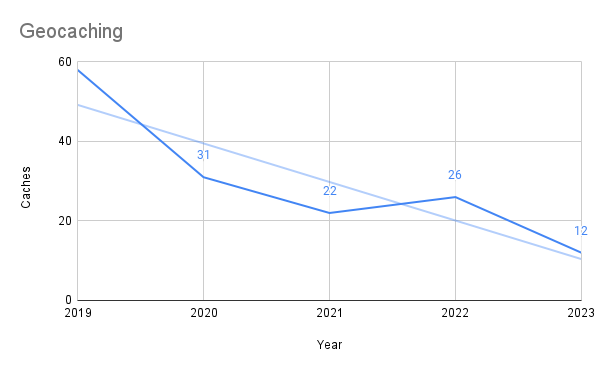
I started using Geocaching in 2019. Trend is downward. Not in the 2016 post.
I was introduced to geocaching at a conference. I struggled to find my first cache on my own, but somehow, eventually, I managed to find one. Since then I’ve found many caches and hidden a few.
GitHub

I started using GitHub in 2008. Trend is upward. Also in 2016 post.
Little did I know in 2008 how important Git and GitHub will be in my life. I wrote a blog post about my first steps in early 2009. (I wish I could put life in version control. There are some things I would not hesitate to revert.)
Goodreads
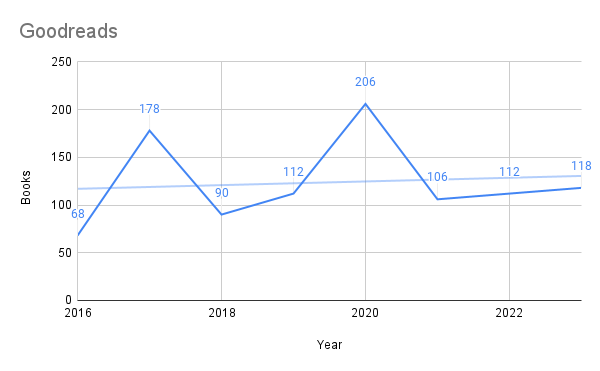
I started using Goodreads in 2016. Trend is upward. Not in the 2016 post.
I have always read a lot of books. I have written a few reviews on this blog. I try to rate and write (usually a very short) review for every book I read.
IMDb
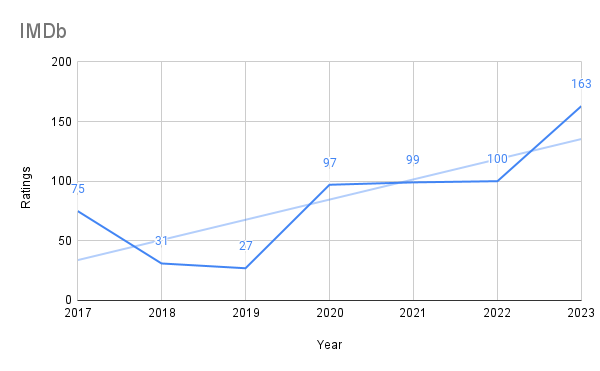
I started using IMDb in 2017.Trend is upward. Not in the 2016 post.
I’m pretty sure I’m not watching TV or movies more than I used to. Mostly because I don’t have much free time. I rarely watch any TV over the week, and only an hour or two over the weekend. The rising numbers might be caused by me recently discovering I can separately rate each episode of a series.
Strava
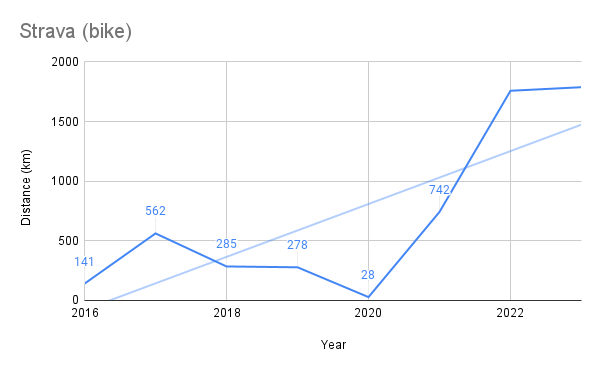
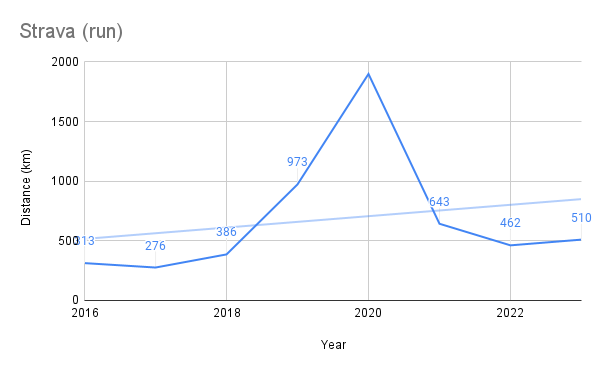
I started using Strava in 2016. Trend is upward. Not in the 2016 post.
I track most of my activities, from swimming to walking and hiking. Mostly, I track running. I have been commuting to work by bike in the last few years, so those numbers increased significantly.
Twitter / X
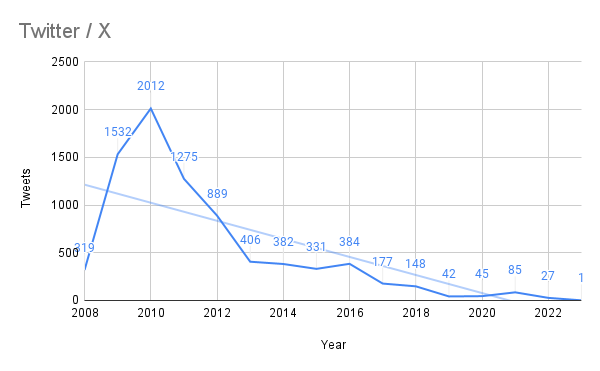
I started using X when it was still cool and called Twitter, in 2008. Trend is downward. Also in 2016 post.
Twitter. (I still refuse to call it X.) I had a lot of fun on Twitter. I can’t use it any more. For various reasons.
Conclusion
I’m using more online services than I did in 2017. Much more. I also care a lot about a few of those services. I think they are very useful.
I use some services more and more every year, some less and less. Some, like Twitter and Facebook, I stopped using. I have a feeling that is correlated with me reading a lot of Cal Newport.
I wish every service would tell you how many minutes a day (or hours a year) you use them. For some services I would really like to know. For some services I’m afraid to know.
For a few services I use (or I have used) regularly I couldn’t get the data. For example, Facebook is taking forever to create an export of my data. I have to check, but it has been weeks since I have requested it. Some services give you data that you can’t do anything with. Maybe you can get something, but I didn’t really try hard.
In any case, this was interesting. I’ll continue gathering more data. I’ll try to update the post as I gather more data.
tags: photo - years